
Real Estate Performance: KPIs That Matter to UAE Investors
Real estate performance KPIs for UAE investors: track net yield, NOI, vacancy, DSCR and liquidity to compare off-plan vs ready and improve returns.
“Great deal” and “great performance” are not the same thing in UAE property. In 2026, investors are choosing between off-plan launches, ready units, short-term rental plays, and long-term lets across multiple emirates. The winners are rarely the most optimistic buyers, they are the ones tracking the right numbers early and consistently.
This guide breaks down real estate performance KPIs that actually matter for UAE investors, and shows how to use them to compare opportunities on a like-for-like basis.
What “real estate performance” should mean in the UAE
Property performance is not a single metric. It is the combined outcome of:
- Return (income plus capital growth)
- Risk (delivery, vacancy, market, financing, FX)
- Liquidity (how easily you can exit at a fair price)
- Time (how long your capital is tied up and when cash flows start)
That matters in the UAE because two properties can show similar headline rental yields yet deliver very different outcomes once you account for service charges, void periods, furnishing, letting fees, and resale liquidity.
A practical way to think about it is:
- Ready property performance is usually driven by operational KPIs (rent, vacancy, costs).
- Off-plan property performance is usually driven by delivery and market-timing KPIs (price uplift during construction, payment plan efficiency, completion risk).
KPI set #1: Acquisition KPIs (you lock these in on day one)
These KPIs determine whether you are starting from a position of strength or spending years “catching up” to fair market value.
Entry price vs market (and vs true comparables)
KPI: Comparable-adjusted entry price
The single most important acquisition KPI is whether you are buying at, below, or above what comparable units are actually achieving.
What to compare:
- Same community or master plan
- Same view orientation (waterfront, golf, road-facing)
- Similar floor level, layout efficiency, balcony size
- Similar handover quality and amenities (especially for branded or serviced assets)
If you cannot explain why your unit should trade at a premium (or a discount) versus comps, treat the pricing as unproven.
Total cash required (not just deposit)
KPI: Total cash-in before first rent
For ready properties, it includes fees and initial set-up. For off-plan, it includes staged payments before handover.
Track your total cash-in because it drives your effective yield and your ability to diversify.
Cost per usable area (not just sq ft on brochure)
KPI: Price per usable sq ft (or price per sqm)
Some units “feel” large on paper but lose usable space to awkward layouts. Usable-area value often shows up later in rentability and resale.
Developer and delivery reliability (for off-plan)
KPI: Delivery track record scorecard
For off-plan deals, you are underwriting a counterparty as much as an asset. A simple internal scorecard (even if qualitative) should track:
- On-time delivery history
- Specification changes between launch and handover
- Post-handover defect resolution responsiveness
- Transparency of progress updates
If you already use a developer KPI template, keep it consistent across all deals so you can compare objectively.
KPI set #2: Income KPIs (the cash-flow engine)
Income metrics look straightforward, but most investor mistakes happen here because they stop at gross yield.
Gross yield (useful, but incomplete)
KPI: Gross rental yield
Formula:
- Gross yield (%) = Annual rent / Purchase price
Gross yield is a screening metric. It helps you shortlist areas and unit types, but it does not tell you what you keep.
Net yield (what you actually keep)
KPI: Net rental yield (after all recurring costs)
Formula:
- Net yield (%) = (Annual rent − annual operating costs) / Total cash invested
Operating costs typically include service charges, routine maintenance, insurance, leasing or management fees, and a vacancy allowance.
If you want one “truth metric” for ready property income performance, net yield is the one.
Net Operating Income (NOI) and expense ratio
KPI: NOI
- NOI = Rental income − operating expenses (excluding financing and tax)
KPI: Operating expense ratio
- Expense ratio (%) = Operating expenses / Rental income
These two KPIs make it easier to compare:
- Furnished vs unfurnished strategies
- Different building service charge levels
- Different management approaches
They also force discipline: if costs rise, your dashboard shows it immediately.
Vacancy and tenant turnover
KPI: Economic vacancy rate
Track vacancy as a percentage of annual rent, not just “weeks empty”. A unit that is empty during peak demand can hurt performance more than a longer void in a low season market.
KPI: Tenant turnover cost per renewal
Turnover is not just lost rent. It is also:
- Leasing commissions
- Refresh and repairs
- Deep cleaning
- Time and coordination cost (often underestimated by offshore owners)
For long-term letting, operational support matters. If you want a smoother tenancy lifecycle (search, legal checks, moving, and ongoing home services), consider specialist platforms such as Movely for stress-free long-term rentals and home services. Use it as a benchmark for what “fully supported” can look like when you are comparing letting options.
KPI set #3: Market KPIs (signals that your strategy is working)
These KPIs help you avoid being “right on the property” but wrong on the micro-market.
Rental growth (reversion potential)
KPI: Market rent growth vs in-place rent
A good long-let asset often has an embedded performance lever: the gap between current rent and achievable rent on renewal.
Track:
- Your current rent
- Achievable rent for comparable active listings
- Recently agreed rents (if accessible through your agent or manager)
Absorption and supply pressure (especially for off-plan)
KPI: Supply pipeline vs demand indicators
You do not need perfect forecasting, but you do need to avoid blind spots:
- How many similar units are scheduled to hand over near the same time?
- Are incentives increasing (a sign of slower absorption)?
- Is the tenant pool expanding (new employers, infrastructure, tourism, education nodes)?
For UAE investors, this is often the difference between “paper appreciation” and a liquid resale market.
Price trend confirmation
KPI: Repeat-sale or index confirmation (where available)
If you track your own portfolio value, use conservative assumptions and seek confirmation from:
- Verified transaction comparables
- Independent valuations (especially if refinancing)
- Local indices and credible market reports
Avoid anchoring to listing prices. Listings measure seller ambition, transactions measure the market.
KPI set #4: Financing and capital efficiency KPIs
Even in a tax-advantaged environment, financing can either amplify returns or quietly destroy them.
Loan-to-value (LTV) and equity at risk
KPI: LTV (%)
- LTV = Loan amount / Property value
Track it over time. If your property appreciates, your effective LTV falls, which can improve refinancing options and reduce risk.
Debt Service Coverage Ratio (DSCR)
KPI: DSCR
- DSCR = NOI / Annual debt service
A DSCR above 1 means the property’s operating income covers debt service before taxes and personal income. Many investors use DSCR as a safety KPI, particularly if rates move.
Interest rate sensitivity
KPI: Break-even rate
Stress test: at what mortgage rate does your DSCR fall below 1, or your cash flow turn negative? This is especially important if you are using variable rates or planning to refinance.
FX impact for international investors
KPI: FX-adjusted return
If your home currency is not AED, your real performance includes FX movement. Track:
- Effective AED cost of each staged payment
- FX rate at purchase vs now
- Hedging costs (if used)
For off-plan staged payments, FX can materially change your effective entry price if you ignore it.
KPI set #5: Exit and liquidity KPIs (often ignored until it is too late)
Returns are only real when you can refinance or exit.
Days on market (DOM) and discount to close
KPI: DOM for comparable resales
In emerging or fast-changing sub-markets, liquidity can shift quickly. Track average time-to-sell for true comparables.
KPI: List-to-close discount (%)
- Discount = (List price − close price) / list price
If discounting increases, your market may be softening even if headline prices look stable.
All-in exit costs
KPI: Exit cost percentage
At a minimum, model:
- Government transfer and admin fees (emirate-specific)
- Agency commission
- Mortgage settlement or release fees (if financed)
- Developer NOC or assignment-related charges (if applicable)
Exit cost modelling is what turns “good ROI” marketing into investor-grade performance analysis.
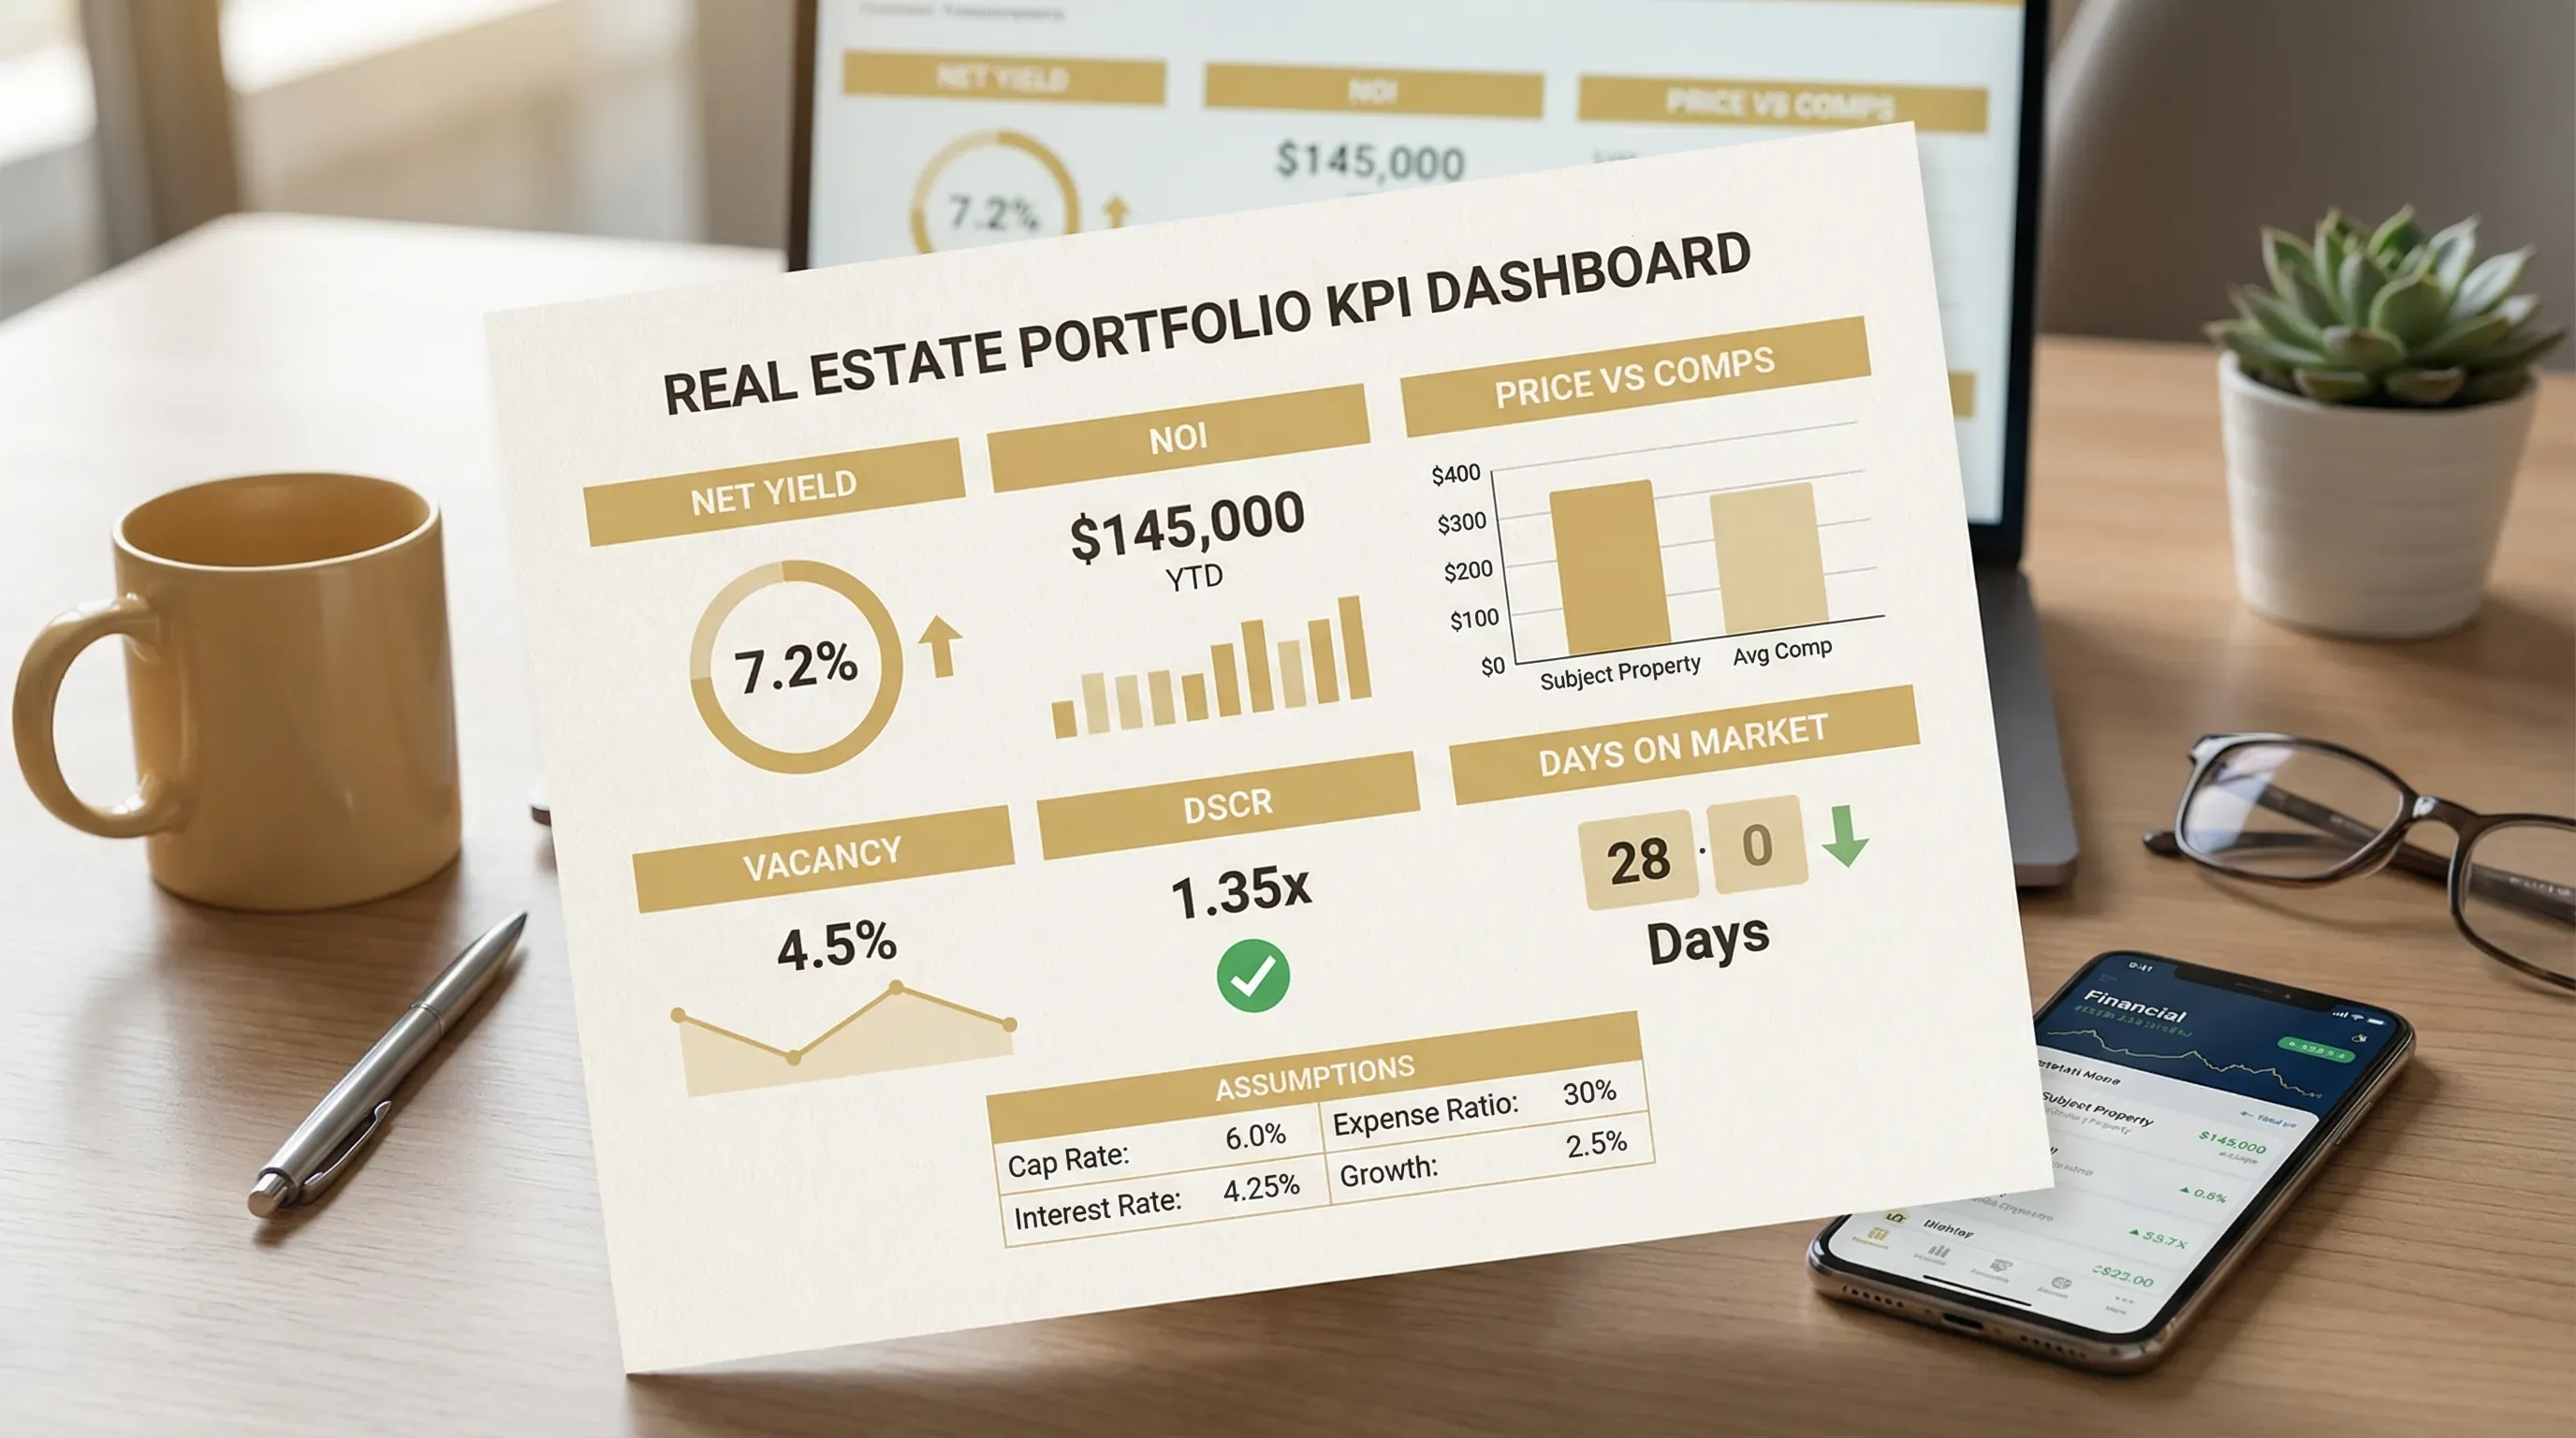
A practical KPI dashboard you can use (template)
The goal is not to track everything. It is to track a small set consistently so decisions get easier every quarter.
Here is a simple structure many UAE investors use for a one-page snapshot.
| KPI category | KPI | What it tells you | How often to review |
|---|---|---|---|
| Acquisition | Entry vs comps | Whether you bought at a defensible price | At purchase, then quarterly |
| Income | Net yield | What you keep after costs | Quarterly |
| Operations | NOI and expense ratio | Whether costs are drifting and why | Quarterly |
| Stability | Economic vacancy | The real cost of voids and churn | Monthly/quarterly |
| Market | Rent reversion gap | Upside at renewal or risk of overpricing | Quarterly |
| Financing | DSCR and break-even rate | Resilience to rate changes | Quarterly |
| Liquidity | DOM and list-to-close discount | How “real” your valuation is | Quarterly |
| Exit | All-in exit cost % | Your minimum profitable holding period | At purchase, then annually |
If you invest off-plan, add two more:
| Off-plan KPI | What it tells you | How often to review |
|---|---|---|
| Construction milestone variance | Delay risk and cash-flow timing shifts | Monthly/quarterly |
| Payment plan efficiency | Whether staged cash outflows match value creation | Quarterly |
Common KPI mistakes UAE investors should avoid
Confusing ROI with IRR
ROI is a simple total return measure. IRR is time-weighted and better for comparing:
- Off-plan deals with staged payments
- Strategies with different holding periods
- Projects where cash flows start later
If you compare off-plan vs ready, IRR usually gives a clearer picture.
Underestimating service charges and lifecycle maintenance
In premium communities, service charges can be a major driver of net yield. Track them as a KPI, and build a maintenance reserve rather than treating repairs as “one-offs”.
Treating short-term rental KPIs as interchangeable with long-term KPIs
If you run short-term lets, occupancy, ADR, and RevPAR matter. For long-term letting, vacancy, tenant quality, and renewal economics matter more.
Mixing the two leads to bad decisions, for example, furnishing a unit for a strategy that does not match the building’s real demand.
Where Azimira fits in a KPI-driven strategy
KPI discipline is easiest when your investment process is structured from the start. Azimira focuses on UAE investment performance through:
- Curated off-plan projects in high-growth markets (including Ras Al Khaimah)
- Market analysis and reports to support pricing, timing, and demand assumptions
- Tailored investment strategies aligned to your goal (growth, income, balanced)
- Dedicated client support to keep execution and follow-through clean
If you already track performance, a specialist partner helps you pressure-test assumptions before you commit capital.
Frequently Asked Questions
What are the most important real estate performance KPIs for UAE investors? The highest-impact KPIs are entry price vs true comps, net yield, NOI, vacancy (economic), DSCR (if financed), and liquidity metrics like days on market and list-to-close discount.
Should I track different KPIs for off-plan vs ready property? Yes. Ready property is driven by operating KPIs (net yield, NOI, vacancy, expenses). Off-plan performance depends more on delivery and market-timing KPIs (milestone variance, payment plan efficiency, resale liquidity at handover).
Is gross rental yield enough to judge a UAE investment? No. Gross yield ignores service charges, maintenance, vacancy, management fees, and letting costs. Net yield and NOI provide a much clearer view of what you actually keep.
How often should I review property performance? Track income, costs, and vacancy at least quarterly, and review market and liquidity KPIs quarterly as well. Off-plan construction progress should be reviewed whenever a milestone update is issued.
What KPI best predicts resale difficulty? Days on market for true comparable resales, plus the list-to-close discount. Together they show whether the market is liquid and whether sellers are having to negotiate materially.
Want a KPI-led investment plan for the UAE?
If you are comparing off-plan opportunities or building a UAE portfolio across different emirates, the fastest way to reduce mistakes is to apply one consistent KPI scorecard to every deal.
Explore Azimira at azimira.com to discuss your objectives, review curated opportunities, and pressure-test performance assumptions before you commit.
Related articles
Capital Investment LLC UAE: Setup Basics for Property Deals
Capital Investment LLC UAE setup basics for property deals: choose mainland or free zone, plan compliance and banking, and execute off-plan purchases smoothly.

First Time Investment Property: 9 Checks Before You Buy
Buying a first time investment property? Use these 9 checks to validate budget, developer, costs, rental demand and exit plan before you buy in the UAE.

Investment Plan in UAE: A Simple Framework for 2026
Investment plan in UAE for 2026: a simple framework to set goals, pick assets, model returns, manage risk, and execute UAE property deals confidently.